
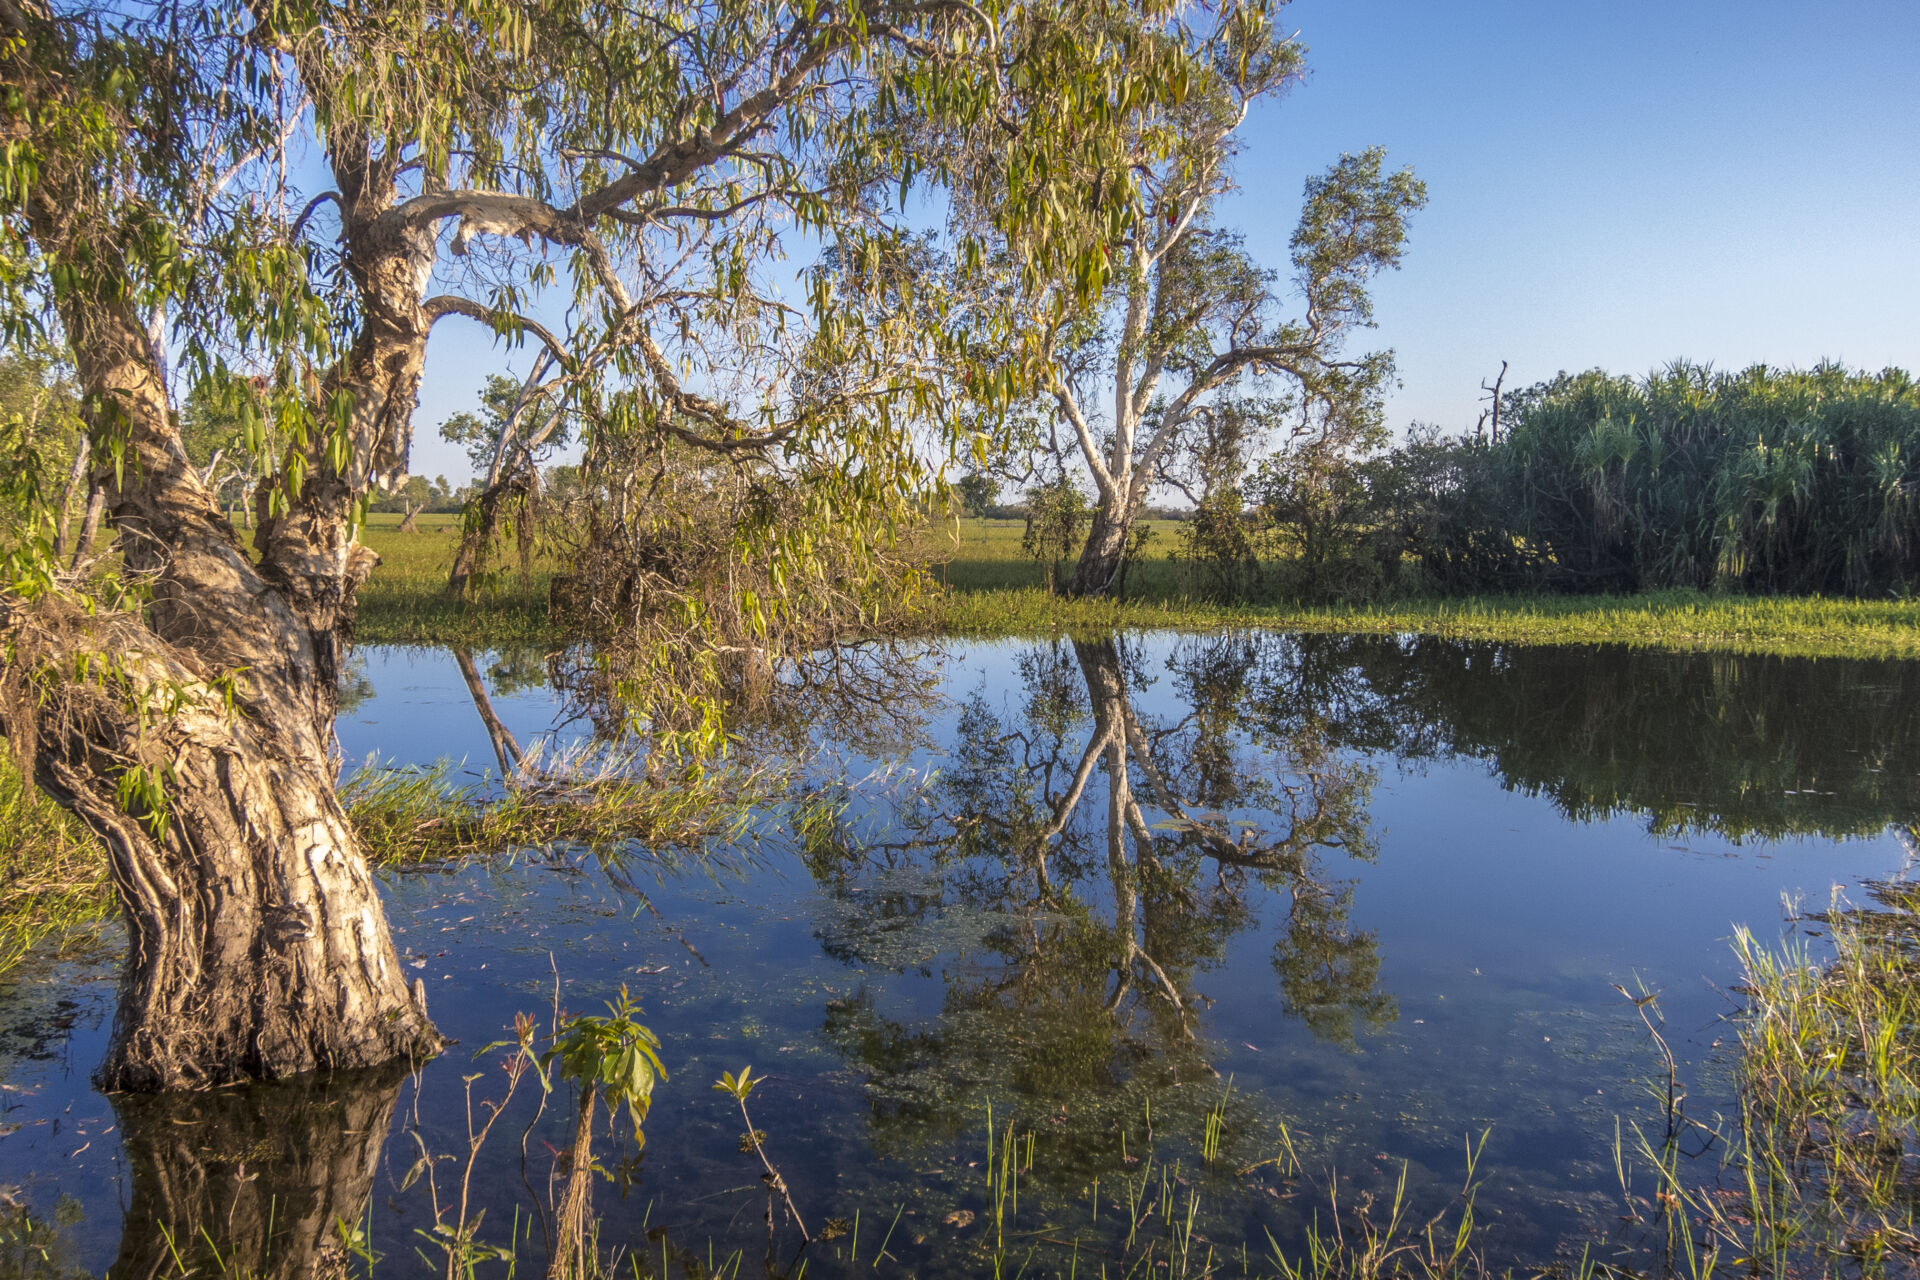
Examples include vegetated floodplains (whether permanent, seasonal or episodic), marshes, groundwater seeps, bogs, peatlands, mires and fens.
Wetlands are often highly variable across both space and time. They often play a critically important role as biodiversity habitats and refuges at a landscape scale.]
This category corresponds to IUCN-GET biome TF1 (Palustrine wetlands).
Metric:
Area of ecosystem asset
Please choose a Metric:
Distance from similar habitat
Please choose a Metric:
Flood protection - number of people and/or buildings in a lower risk category
Please choose a Metric:
Flood protection - number of people and/or buildings in a lower risk category - monetary value
Units
Example methods / guidance / references
What are tiers?
Tier 1
Estimate using own judgement and observations
For example, estimate % of total land area covered by ecosystem type, multiplied by total land area.
Tier 2
Estimate using third-party professional estimates or public data
Tier 3
Model or measure based on site-specific surveys/sampling, remote or in-field sensing, laboratory analysis, etc.
Example data sources
Internal records
Third-party data sources
To the best of our knowledge there is not currently any interactive map of Australian ecosystem extent classified according to the IUCN-GET typology applicable at property-level scale. Maps of ecosystem extent classified according to the IUCN-GET typology for certain regions globally are available at the Global Ecosystems Atlas.
Maps showing extent of Australian wetlands as a land use type are available at National Map – Catchment Scale Land Use 2020 – Secondary classification(select layer: Catchment Scale Land Use 2020 – Secondary classification, which shows Marsh/wetland as a category).
Site-specific measurements or model outputs
Data on Australian ecosystem extent classified according to the IUCN-GET typology are available at CSIRO Data Access Portal – Spatial extent of IUCN ecosystem functional groups at 250 m resolution for freshwater, terrestrial, marine and transitional realms for Australia: pre-1750, 2010-11, 2015-16 and 2020-21.
Data on extent of Australian wetlands as a land use type at various scales are available at Australian Bureau of Agricultural and Resource Economics and Sciences (ABARES) – Land use data download.
Notes
Work in progress - Feedback welcome
Last updated: 8th May 2025
Type
SEEA ECT Class
Units
Example methods / guidance / references
What are tiers?
Tier 1
Estimate using own judgement and observations
Tier 2
Estimate using third-party professional estimates or public data
Methods for measuring distance to core area, defined as any patch of native vegetation greater than 50 ha in size, regardless of vegetation type, condition or tenure, using aerial imagery, vegetation mapping and/or visual assessment can be found in AfN-METHOD-NV-11 “Tasmanian Vegetation Condition Method”.
Tier 3
Model or measure based on site-specific surveys/sampling, remote or in-field sensing, laboratory analysis, etc.
Example data sources
Internal records
Third-party data sources
Site-specific measurements or model outputs
Data on extent and distribution of Australian vegetation types, from which distance to similar habitat could be manually determined, are available at the National Vegetation Information System (NVIS).
Notes
Distance from similar habitat can be defined in different ways.
Last updated: 8th October 2024
Units
SEEA ES sub-type
Intermediate or final
Example methods / guidance / references
What are tiers?
Tier 1
Estimate using own judgement and observations
Tier 2
Estimate using third-party professional estimates or public data
Tier 3
Model or measure based on site-specific surveys/sampling, remote or in-field sensing, laboratory analysis, etc.
Example data sources
Internal records
Third-party data sources
Site-specific measurements or model outputs
Notes
This metric refers to the number of people and/or buildings that can be identified as being in a lower flood risk category than they would have been in the absence of the ecosystem providing the flood mitigation service. Usually this involves an assumption that the relevant ecosystem would otherwise have been bare land (see SEEA-EA 2021, Table 7.7), and requires some form of hydrological modelling to determine risk exposure in the existing situation as well as the baseline scenario.
River flood mitigation services may be provided along with water flow regulation services (including baseline flow maintenance services and peak flow mitigation services).
Last updated: 29th November 2024
Units
Example methods / guidance / references
What are tiers?
Tier 1
Estimate monetary value of ecosystem contribution from replacement cost.
For example, estimate how much it would cost to provide flood protection if the ecosystem service was not available (NCAVES and MAIA, 2022).
Tier 2
Estimate monetary value of ecosystem contribution from replacement cost.
For example, estimate how much it would cost to provide flood protection if the ecosystem service was not available (NCAVES and MAIA, 2022).
Tier 3
Estimate monetary value of ecosystem contribution from avoided damages.
For example, estimate the cost of avoided flood damages that would be incurred in the absence of the ecosystem service (NCAVES and MAIA, 2022).
Example data sources
Internal records
Third-party data sources
Site-specific measurements or model outputs
Notes
Work in progress - Feedback welcome
Last updated: 3rd December 2024
Units
SEEA ES sub-type
Intermediate or final
Example methods / guidance / references
What are tiers?
Tier 1
Estimate using own judgement and observations
Tier 2
Estimate using third-party professional estimates or public data
For example, estimate using satellite data or forage budget service providers.
Tier 3
Model or measure based on site-specific surveys/sampling, remote or in-field sensing, laboratory analysis, etc.
For example, model using satellite data plus formal on-site assessment including a stratified sampling scheme and data collection and analysis protocol.
Example data sources
Internal records
Third-party data sources
Site-specific measurements or model outputs
Notes
Grazed biomass provisioning is technically an intermediate service provided to livestock, with the livestock then providing the final service of livestock provisioning. However, following SEEA-EA 2021 (para. 6.56) it is recommended that grazed biomass provisioning is considered as the primary ecosystem contribution. Where there is a mix of ecosystem contributions and human contributions (e.g. through addition of fertiliser) to the grazed biomass provisioning service, ideally the ecosystem contribution should be estimated as a percentage of the total. Likewise, if measured via a proxy such as the stocking rate, corrections should be made for other inputs, such as supplementary feed (unless sourced from the same ecosystem, over the same time period).
Last updated: 6th January 2025
Units
Example methods / guidance / references
What are tiers?
Tier 1
Estimate monetary value of ecosystem contribution from residual value.
For example, deduct user costs (e.g. costs of production, extraction/harvesting and processing, plus financial costs such as depreciation and return on produced assets, minus subsidies on extraction, plus taxes on extraction) from revenues from extracted/harvested products, to derive a monetary value for the ecosystem contribution (NCAVES and MAIA, 2022).
Tier 2
Estimate monetary value of ecosystem contribution from replacement cost.
For example, estimate how much it would cost to feed livestock if the grazed biomass was not available (NCAVES and MAIA, 2022).
Tier 3
Estimate monetary value of ecosystem contribution from directly observed prices.
For example, if grazed land is privately owned and has a market price, then either an explicit price from a rental market or an implicit price derived from the market value of land, assuming a market rate of return, may be used to represent the right to use grazed biomass (NCAVES and MAIA, 2022).
Example data sources
Internal records
Third-party data sources
Site-specific measurements or model outputs
Notes
Work in progress - Feedback welcome
Last updated: 3rd December 2024
Type
SEEA ECT Class
Units
Example methods / guidance / references
What are tiers?
Tier 1
Estimate using own judgement and observations
Tier 2
Estimate using third-party professional estimates or public data
Methods for measuring patch size using aerial imagery, vegetation mapping and/or visual assessment can be found in AfN-METHOD-NV-11 “Tasmanian Vegetation Condition Method”.
Tier 3
Model or measure based on site-specific surveys/sampling, remote or in-field sensing, laboratory analysis, etc.
Example data sources
Internal records
Third-party data sources
Maps showing satellite imagery, from which patch size could be manually determined, are available from Google Maps.
Site-specific measurements or model outputs
Data on extent and distribution of Australian vegetation types, from which patch size could be manually determined, are available at the National Vegetation Information System (NVIS).
Notes
Work in progress - Feedback welcome
Last updated: 16th October 2024
Type
SEEA ECT Class
Units
Example methods / guidance / references
What are tiers?
Tier 1
Estimate using own judgement and observations
Methods for measuring non-native plant cover, or the percentage cover of the total vegetation cover that is comprised of exotic and non-indigenous species, using visual observation can be found in AfN-METHOD-NV-01 “Land Restoration Fund (LRF) Native Vegetation Monitoring Method” and AfN-METHOD-NV-06 “Accounting for Nature and Landcare Farming Native Vegetation Method“.
Methods for measuring lack of weeds, defined as weeds percentage cover of all native plant species, can be found in AfN-METHOD-NV-11 “Tasmanian Vegetation Condition Method”.
Tier 2
Estimate using third-party professional estimates or public data
Tier 3
Model or measure based on site-specific surveys/sampling, remote or in-field sensing, laboratory analysis, etc.
Example data sources
Internal records
Third-party data sources
Site-specific measurements or model outputs
Data on identified natural and modified areas of Australia are available at Find Environmental Data – Natural areas of Australia – 100 metre. Note that this source only provides a binary classification into areas presumed to be relatively natural, and those that have been highly modified – not the actual proportion of native species.
Notes
Work in progress - Feedback welcome
Last updated: 6th January 2025
Units
SEEA ES sub-type
Intermediate or final
Example methods / guidance / references
What are tiers?
Tier 1
Estimate using own judgement and observations
A variety of greenhouse gas accounting tools for Australian primary industries, some of which include methods to estimate sequestered and/or retained carbon, can be found at the Primary Industries Climate Challenges Centre (PICCC).
Tier 2
Estimate using third-party professional estimates or public data
Tier 3
Model or measure based on site-specific surveys/sampling, remote or in-field sensing, laboratory analysis, etc.
Example data sources
Internal records
Third-party data sources
Data on Australian forest and harvested wood product carbon stocks by state/territory and type of forest are available at the latest version of Australia’s State of the Forests Report (select Criterion 5: Maintenance of forest contribution to global carbon cycles).
Site-specific measurements or model outputs
Data on Australian carbon stocks are available at Full Carbon Accounting Model (FullCAM).
Notes
The ecosystem service of carbon retention is measured by the opening stock of retained carbon (see SEEA-EA s. 6.4.3, pp. 139-140) as a proxy for the flow of this service. The scope conventionally covers above- and below-ground living and dead biomass and soil carbon up to 2m depth. Carbon retained in harvested wood products should not be considered an ecosystem service (SEEA-EA, s. 6.4.3, pp. 139-140), although it could be included in an entity’s carbon account or impact statement. An increase in retained carbon from year to year should equal the flow of the ecosystem service of carbon sequestration.
Last updated: 6th January 2025
Units
Example methods / guidance / references
What are tiers?
Tier 1
Estimate monetary value of ecosystem contribution from avoided damages.
For example, multiply the total amount of carbon stored at the beginning of the accounting period by a suitable cost of carbon, and multiply this amount by a suitable rate of return to create an annuity representing the flow of retained carbon services. A suitable cost of carbon for Tier 1 might be a social cost of carbon derived from the literature (see discussion of the range of possible values in NCAVES and MAIA, 2022).
Tier 2
N/A
Tier 3
Estimate monetary value of ecosystem contribution from avoided damages.
For example, multiply the total amount of carbon stored at the beginning of the accounting period by a suitable cost of carbon, and multiply this amount by a suitable rate of return to create an annuity representing the flow of retained carbon services. A suitable cost of carbon for Tier 3 might be a social cost of carbon derived from a national model (see NCAVES and MAIA, 2022).
Example data sources
Internal records
N/A
Site-specific measurements or model outputs
Notes
Technically, the full price paid in ERF auctions per tonne of CO₂e sequestered is for the combined services of carbon sequestration and retention for 100 years. However, it can be assumed that the price component for annual retention is small, therefore the ERF price approximates the current value of carbon sequestration services.
Last updated: 3rd December 2024
Units
SEEA ES sub-type
Intermediate or final
Example methods / guidance / references
What are tiers?
Tier 1
Estimate using own judgement and observations
A map-based calculator for Australian landholders to estimate their emissions and annual sequestered carbon is available at the Platform for Land and Nature Repair (PLANR).
A variety of greenhouse gas accounting tools for Australian primary industries, some of which include methods to estimate sequestered and/or retained carbon, can be found at the Primary Industries Climate Challenges Centre (PICCC).
Tier 2
Estimate using third-party professional estimates or public data
Tier 3
Model or measure based on site-specific surveys/sampling, remote or in-field sensing, laboratory analysis, etc.
Example data sources
Internal records
Third-party data sources
Data on Australian forest and harvested wood product carbon stocks by state/territory and type of forest are available at the latest version of Australia’s State of the Forests Report (select Criterion 5: Maintenance of forest contribution to global carbon cycles).
Site-specific measurements or model outputs
Data on Australian carbon stocks are available at Full Carbon Accounting Model (FullCAM).
Notes
Additional tools are available to estimate potential changes in net emissions or sequestration from various project activities, such as LOOC-C.
Last updated: 6th January 2025
Units
Example methods / guidance / references
What are tiers?
Tier 1
Estimate monetary value of ecosystem contribution from directly observed prices.
For example, multiply the total amount of carbon sequestered over the accounting period by a suitable cost of carbon derived from observed prices in a relevant emissions trading scheme (NCAVES and MAIA, 2022). The relevant tier would depend on the granularity and accuracy of the underlying biophysical model and/or measurements used to estimate the physical flow of carbon sequestration services.
Tier 2
Estimate monetary value of ecosystem contribution from directly observed prices.
For example, multiply the total amount of carbon sequestered over the accounting period by a suitable cost of carbon derived from observed prices in a relevant emissions trading scheme (NCAVES and MAIA, 2022). The relevant tier would depend on the granularity and accuracy of the underlying biophysical model and/or measurements used to estimate the physical flow of carbon sequestration services.
Tier 3
Estimate monetary value of ecosystem contribution from directly observed prices.
For example, multiply the total amount of carbon sequestered over the accounting period by a suitable cost of carbon derived from observed prices in a relevant emissions trading scheme (NCAVES and MAIA, 2022). The relevant tier would depend on the granularity and accuracy of the underlying biophysical model and/or measurements used to estimate the physical flow of carbon sequestration services.
Example data sources
Internal records
Third-party data sources
Site-specific measurements or model outputs
Notes
Work in progress - Feedback welcome
Last updated: 3rd December 2024
Type
SEEA ECT Class
Units
Example methods / guidance / references
What are tiers?
Tier 1
Estimate using own judgement and observations
Tier 2
Estimate using third-party professional estimates or public data
Methods for measuring site context, or the percentage of retained remnant vegetation, using GIS can be found in AfN-METHOD-NV-01 “Land Restoration Fund (LRF) Native Vegetation Monitoring Method”, AfN-METHOD-NV-06 “Accounting for Nature and Landcare Farming Native Vegetation Method”, AfN-METHOD-NV-07 “Bush Heritage Australia – Vegetation Assessment Methodology” and AfN-METHOD-NV-08 “Method to assess the productive and environmental condition of permanent perennial pastures throughout Australia“.
Methods for measuring neighbourhood context can be found in AfN-METHOD-NV-11 “Tasmanian Vegetation Condition Method”.
Tier 3
Model or measure based on site-specific surveys/sampling, remote or in-field sensing, laboratory analysis, etc.
Example data sources
Internal records
Third-party data sources
Maps of Australian vegetation types in a given area are available at the National Vegetation Information System (NVIS).
Maps of native and derived vegetation in a given area within the Australian Capital Territory are available at the ACT Government Geospatial Catalogue.
Site-specific measurements or model outputs
Data on Australian vegetation types in a given area are available at the National Vegetation Information System (NVIS).
Data on native and derived vegetation in a given area within the Australian Capital Territory are available at the ACT Government Geospatial Catalogue – ACTGOV Vegetation Map 2023.
Notes
Work in progress - Feedback welcome
Last updated: 6th January 2025
Type
SEEA ECT Class
Units
Example methods / guidance / references
What are tiers?
Tier 1
Estimate using own judgement and observations
Tier 2
Estimate using third-party professional estimates or public data
Methods for measuring native plant species richness per life form (trees, shrubs, grasses and forbs/other) using visual observation can be found in AfN-METHOD-NV-01 “Land Restoration Fund (LRF) Native Vegetation Monitoring Method”.
Methods for measuring native species count for tree canopy and shrub layer species can be found in AfN-METHOD-NV-07 “Bush Heritage Australia – Vegetation Assessment Methodology”.
Tier 3
Model or measure based on site-specific surveys/sampling, remote or in-field sensing, laboratory analysis, etc.
Methods for measuring terrestrial mammal species richness using wildlife camera records can be found in AfN-METHOD-F-01 “Accounting for Nature Australian Terrestrial Mammal Method”.
Methods for measuring aquatic vertebrate species richness using eDNA measurement can be found in AfN-METHOD-F-05 “EnviroDNA Aquatic Vertebrate eDNA Method”.
Example data sources
Internal records
Third-party data sources
Maps showing the number of species in a given area are available at the Atlas of Living Australia (select layer: Species richness).
Site-specific measurements or model outputs
Data on the number of species in a given area are available at the Atlas of Living Australia (select layer: Species richness).
Notes
Species richness can be defined as “The number of species within a given sample, community, or area” (IPBES). It is one way of measuring species diversity, which is itself only one aspect of overall biodiversity. The concept of richness can also be applied at other levels, from genetic (e.g. the number of distinct genotypes within a species) to the number of represented genera, families, etc. It can be useful to supplement richness information with information on abundances or relative abundance distributions.
Depending on the purpose of measurement, and the measurement resources available, the concept of species richness may be applied to certain sets (e.g. plants, mammals, birds, invertebrates, endemic species, etc.). It is important to recognise that observations from one set may not apply to other sets in the same area.
It is usually not feasible to count all species, even within a limited set, within a given area. Therefore some form of sampling method is usually applied to come up with a sample set that can feasibly be measured. Many different sampling methods may be used, and the number of samples required will depend on the measurement objectives (e.g. desired accuracy and confidence), the sample measurement method (e.g. size of sample areas), and the actual variation in the measured quantity across the given area. There are also many different measurement methods and technologies at the sample measurement level (e.g. pit traps for insects, camera traps for animals, acoustic methods for birds). There is no single ‘right’ method that applies in all circumstances. Whatever method is used, it is important that it should be applied consistently for a given site over time, and appropriate to the measurement objectives and ecosystem type. Measurements using different methods may not necessarily be comparable.
Last updated: 6th January 2025