
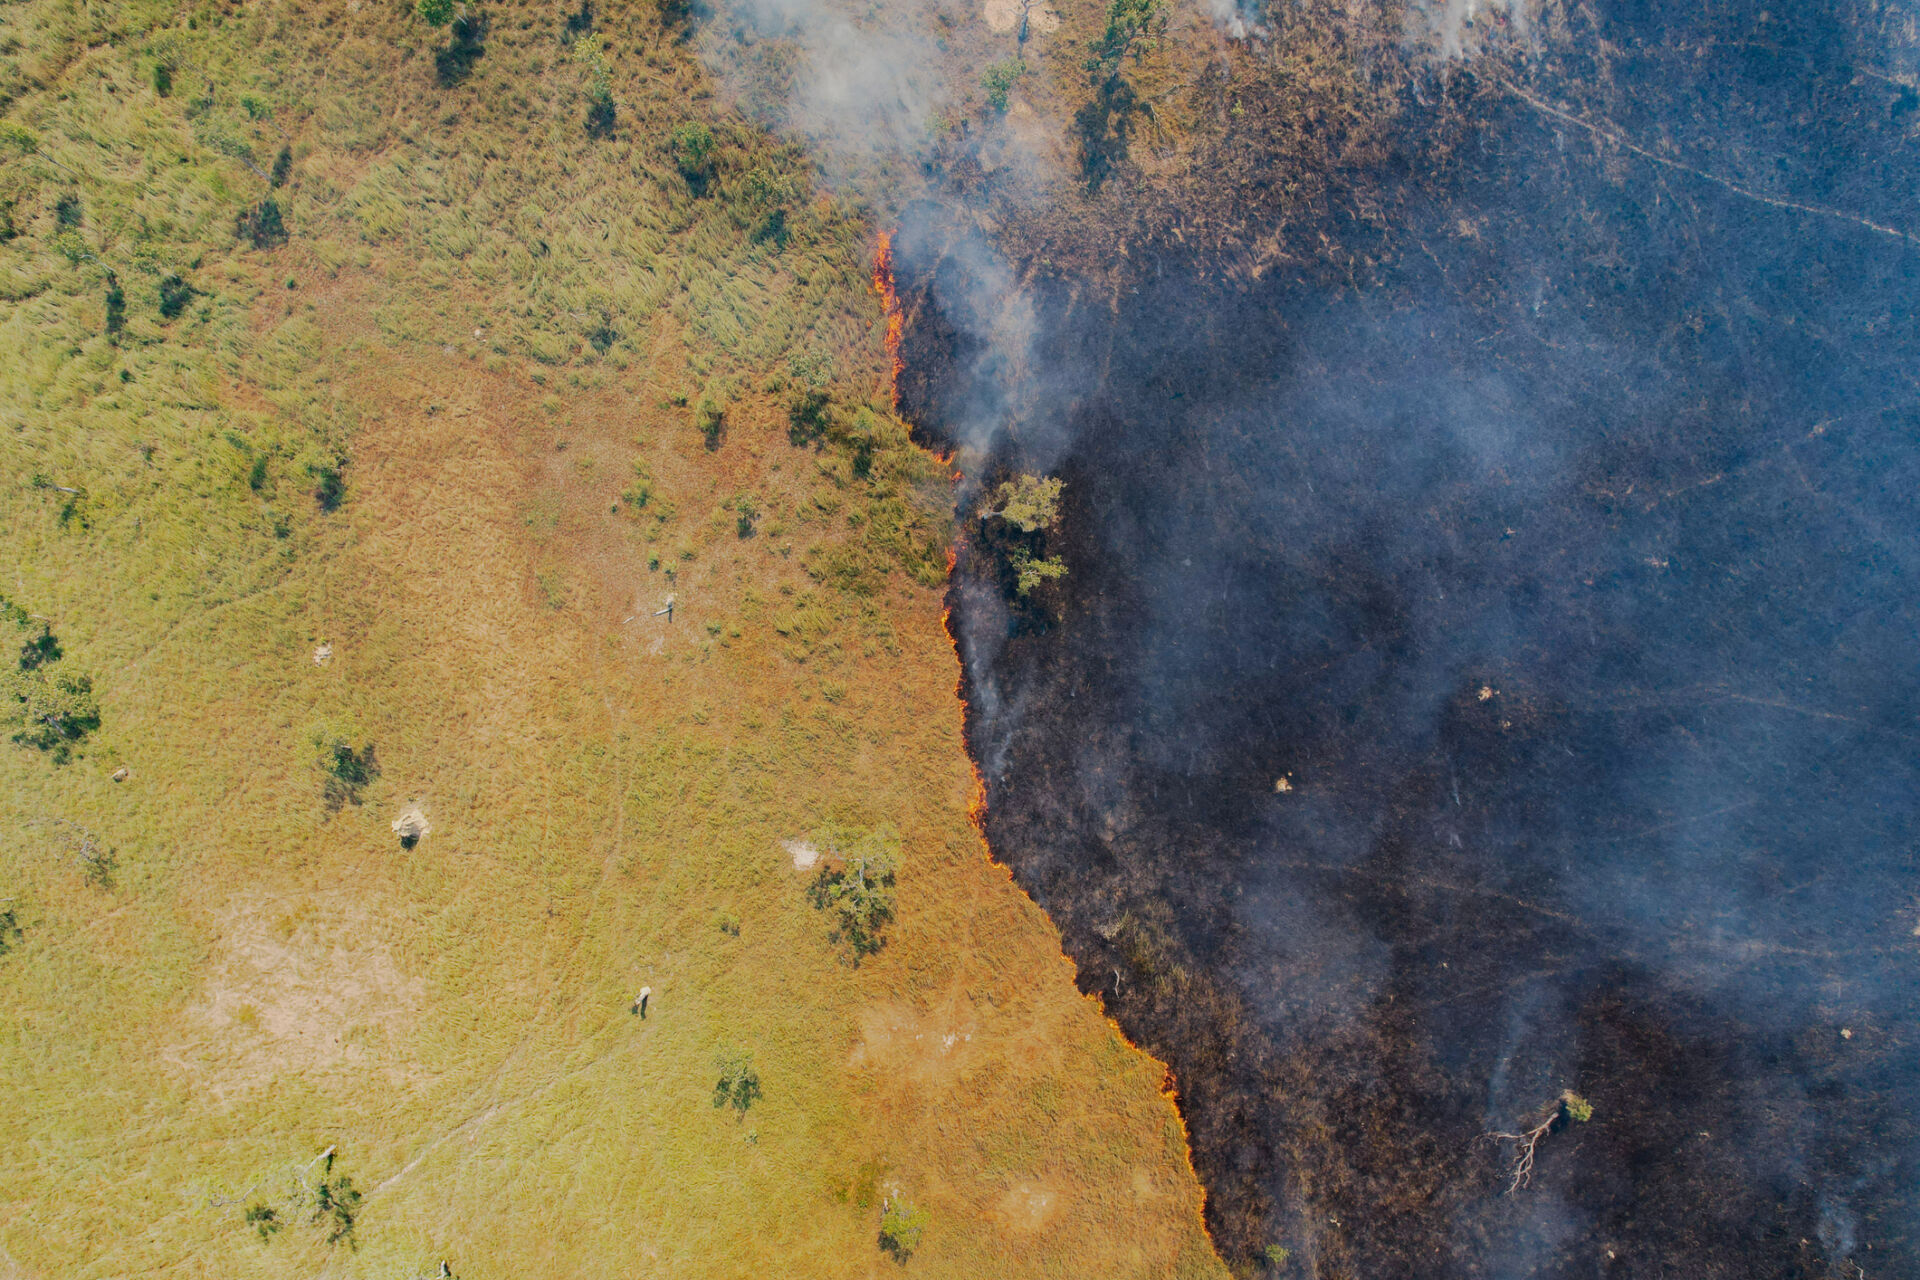
Metric:
Proportion of land area or production unaffected by bushfire
Units
Example target
Example methods / guidance / references
What are tiers?
Tier 1
Estimate using own judgement and observations
Tier 2
Estimate using third-party professional estimates or public data
Tier 3
Model or measure based on site-specific surveys/sampling, remote or in-field sensing, laboratory analysis, etc.
Example data sources
Internal records
Third-party data sources
Maps of Australian bushfire activity showing area burnt this year, last year and two years ago are available at MyFireWatch.
Maps of northern Australian fire histories since the year 2000 are available at North Australia & Rangelands Fire Information (NAFI)
Maps showing historical burnt areas across Australia from the early 1900s through to 2023 are available at the Digital Atlas of Australia – Historical Bushfire Boundaries.
Site-specific measurements or model outputs
Data on northern Australian fire history since the year 2000 are available at North Australia & Rangelands Fire Information (NAFI)
Data on Victorian fire history are available at DataVic – Fire History showing the number of times areas have been burnt, based on mapped fire history (scars).
Data on global monthly burnt areas are available at the Land Processes Distributed Active Archive Center (LP DAAC) – MODIS/Terra+Aqua Burned Area Monthly L3 Global 500m SIN Grid V061.
Notes
As bushfire events are likely to be relatively infrequent, it may be appropriate to express this metric as the rolling average for a representative period, e.g. the last 30 years. Note that this measure is not simply the inverse of the related impact metric, as the impact metric may include areas burned outside the relevant ecosystem area, whereas the dependency metric only includes areas burned within the relevant ecosystem area.
Last updated: 3rd January 2025