Metric:
Water withdrawal and consumption
Type
Related framework / metric
TNFD: C3.0, A3.0, A3.1, A3.2, A3.3, FA.C3.0, FA.A2.6
Units
Example target
Example methods / guidance / references
What are tiers?
Tier 1
Estimate using own judgement and observations
For example, estimate from average water withdrawal rates, multiplied by period of water withdrawal, multiplied by assumed percentage of withdrawn water that is not returned to the same source in the same period.
Tier 2
Estimate using third-party professional estimates or public data
Tier 3
Model or measure based on site-specific surveys/sampling, remote or in-field sensing, laboratory analysis, etc.
For example, measure water withdrawals and returns using on-site flow meters and water level loggers.
Example data sources
Internal records
Third-party data sources
Data on aggregated water consumption by type of user for Australian river regions are available at the Bureau of Meteorology – National Water Account.
Site-specific measurements or model outputs
Notes
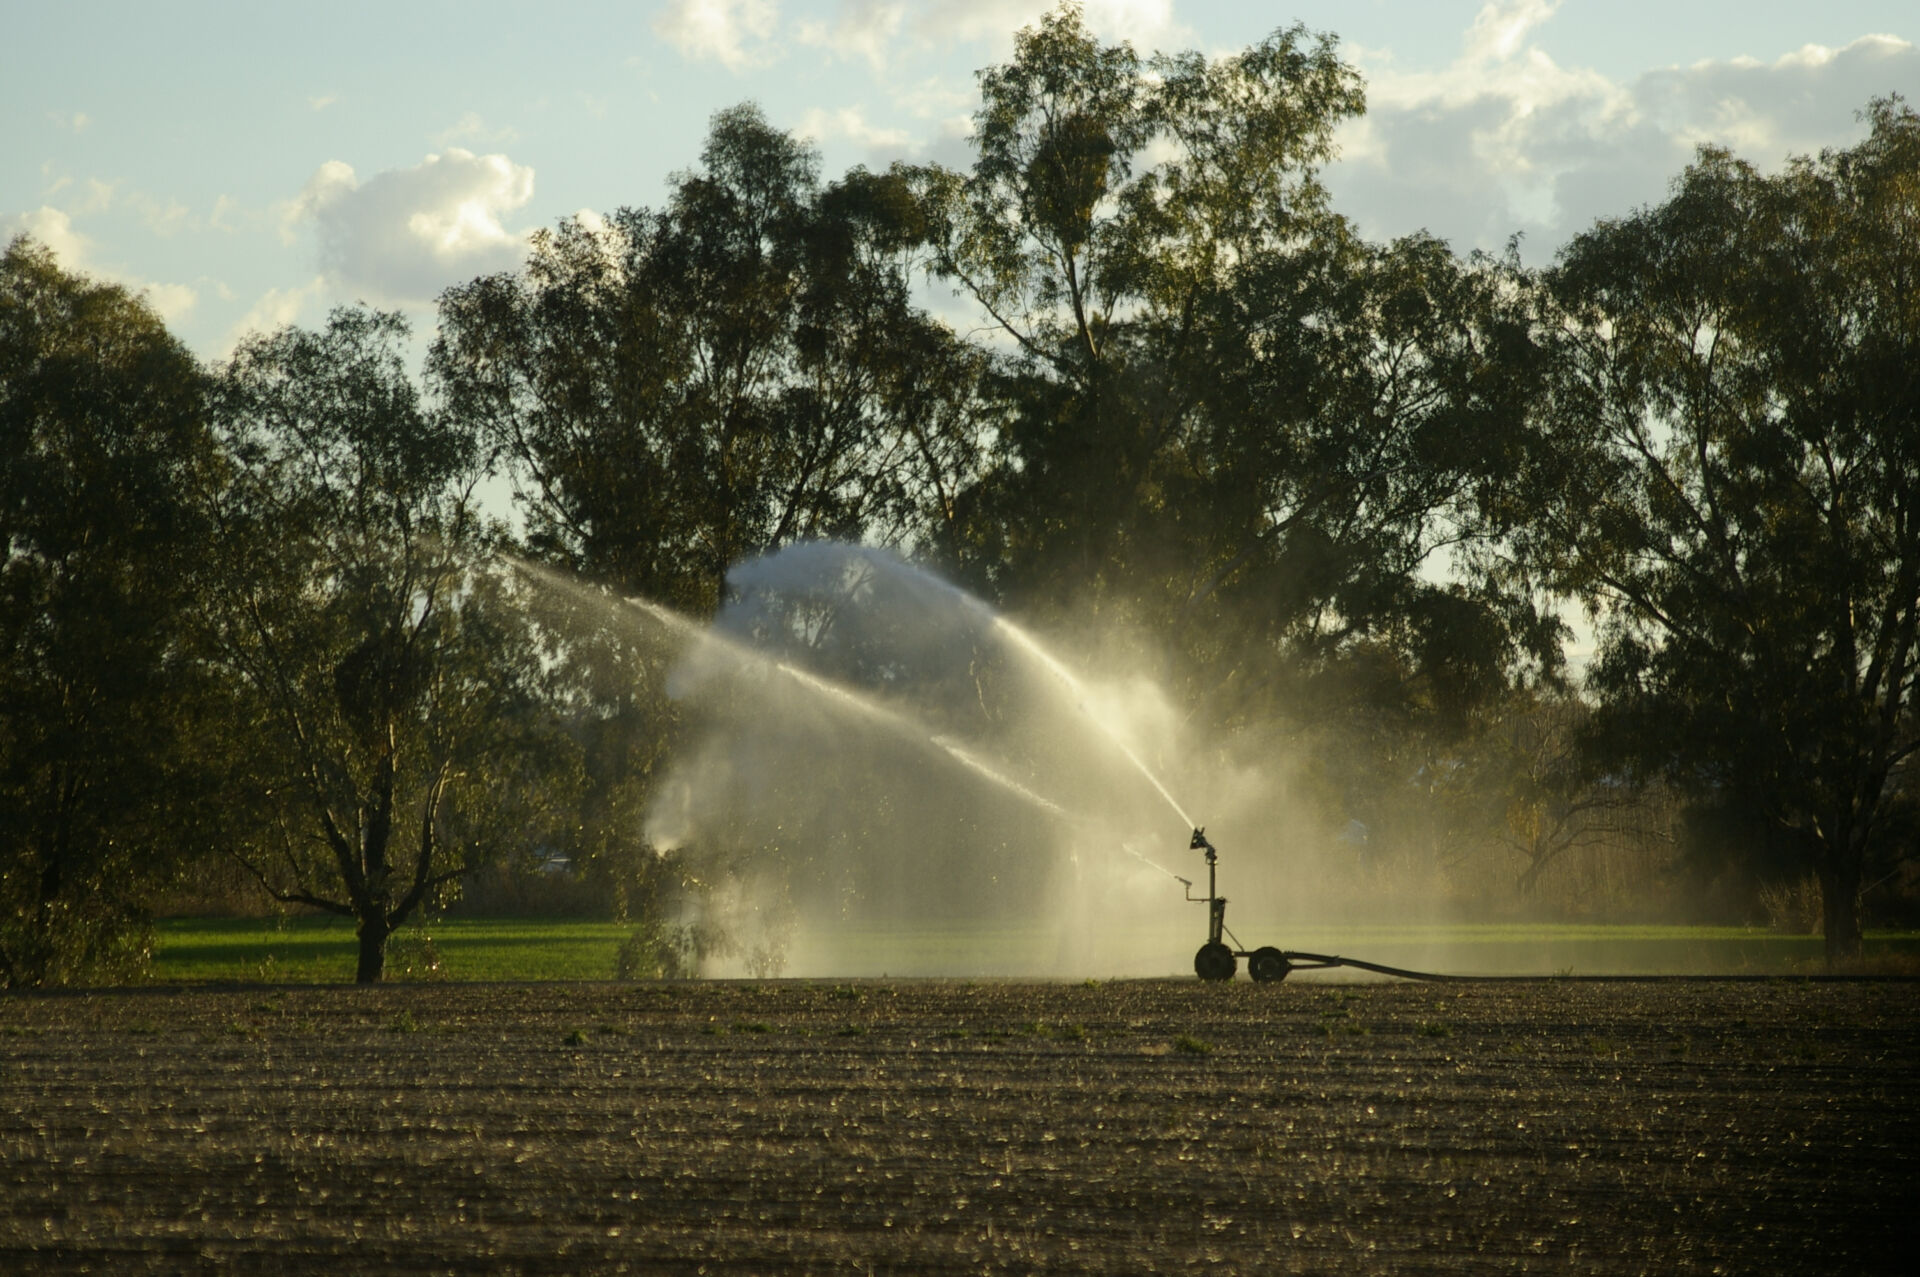
Water withdrawal and consumption, or consumptive water use, refers to human appropriation of surface water or groundwater, as opposed to human appropriation of evaporative flows of water from a catchment (which is captured under NCMC metric ‘Plant water use’). Consumptive water use includes the extraction of water that is either not recharged, or used beyond its recharge rate (signs of this might include declining groundwater levels or lake/river levels or flow rates), or diverted away from other ecosystem uses (for example, water used for irrigation or stock drinking water). This is broadly equivalent to the concept of the ‘blue’ water footprint (see Water Footprint Network). Consumptive water use can be calculated in absolute quantities of water, and/or multiplied by a water scarcity index (e.g. AWARE) to calculate a water scarcity footprint. Alternatively, measurement of consumptive water use can focus on use of water from water-stressed catchments. Components of consumptive water use (e.g. water extracted, water losses, water used and water returned) may be recorded separately.
Water scarcity or water stress should ideally be calculated using a comprehensive hydrological model with robust data for specific catchments. In the absence of such modelling, an indication of potential water scarcity or water stress in Australian water catchments could be a declining long-term trend in groundwater levels or streamflow. Data on groundwater level trends for Australian aquifers can be obtained from the Bureau of Meteorology Australian Groundwater Insight, and data on streamflow trends for Australian rivers can be obtained from the Bureau of Meteorology Hydrologic Reference Stations.
Variants of this metric include:
TNFD core disclosure metric C3.0: “Water withdrawal and consumption (m³) from areas of water scarcity, including identification of water source. Water consumption is equal to water withdrawal less water discharge. Reference: GRI (2018) GRI 303-5. Surface water; groundwater; seawater; produced water; third-party water. Reference: GRI (2018) GRI 303-3.”
TNFD additional disclosure metric A3.0: “Total volume of water withdrawal and consumption (m³).”
TNFD additional disclosure metric A3.1: “Volume of water (m³) replenished to the environment through replenishment programmes (split into total and to areas of water scarcity).”
TNFD additional disclosure metric A3.2: “Total volume (m³) or percentage of water (total, freshwater, other) reduced, reused or recycled.”
TNFD additional disclosure metric A3.3: “Volume (m³) of water loss mitigated.”
TNFD Food and agriculture core disclosure metric FA.C3.0: “Proportion (%) of agricultural products or animal feed produced or sourced from regions with high or extremely high baseline water scarcity.”
TNFD Food and agriculture additional disclosure metric FA.A2.6: “Water Use Efficiency (WUE) calculated as net value added per volume of water use (currency/m³).”
Last updated: 18th September 2025

